Last
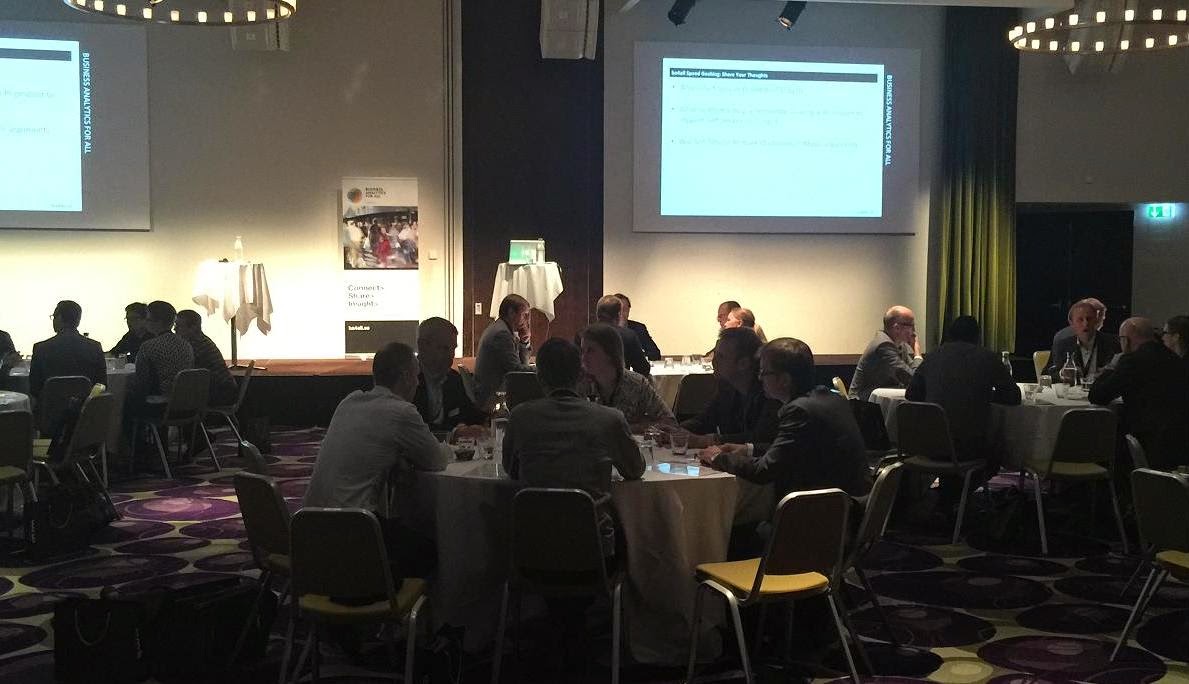
October 18, I took part in a peer exchange with about 60 analytics
professionals to reflect on three questions:
- · What are the top three reasons for Shadow BI?
- · What are the top three opportunities Shadow BI may bring to the organisation?
- · What are the top three solutions for the issues it brings about?
 |
| One of the ten peer exchange products |
The group
process produced some interesting insights as indicated in the previous post.
Some of
these remarks triggered me to elaborate a bit more on them.
Some of them download open source data science
tools like Weka and KNIME and take it a step further using fancier regression
techniques as well as machine learning and deep learning to come up with new
insights.
There we have it: the citizen data scientist. A
another big promise, launched by Gartner a couple of years ago. The suggestion
that anyone can be a data miner is simply pie in the sky. Would you like to be
treated by citizen brain surgeon? I will
not dwell on this too much but let me wrap it up with the term “spurious correlations”
and a nice pic that says it all from Tyler Vigen’s website  |
| A funny example of what happens when you mix up correlation with causation |
Other, frequently mentioned reasons were the
lack of business knowledge, changing requirements from the business and the inadequate funding clearly indicate a
troubled relationship between ICT and the business as the root cause for Shadow
BI.
I wrote “Business
Analysis for Business Intelligence” exactly for this reason. The people with
affinity for and knowledge of both the business and the IT issues in BI are a
rare breed. And even if you find that
rare species in your organisation, chances are you’re dealing with an IT
profile that has done the BI trick a few times for a specific business function
and then becomes a business analyst. And
worse, if this person come from application development, chances are high he or
she will use what I call the “waiter’s waterfall method” . The term “waiter” meaning
he or she will bring you exactly what you asked for. The term “waterfall” to describe
the linear development path and by the time the “analytical product” is
delivered, the business is already looking at new issues and complaining about
obsolete information . Some participants at the peer exchange claimed that
agile BI was the silver bullet but I beg to differ. The optimum solution is “infrastructural agility” which means two approaches. First you need complete insight in the
data structure of minimally the business function impacted and preferably on an
enterprise level. Only then can you challenge the requirements and indicate opportunities
for better decision making by adding other data feeds. In a Big Data scenario
you can add open data and other external data sources to that landscape. The
second is about analysing the decision making processes your counterpart is
involved in. The minimum scope is within his or her domain, the optimum analysis is
the interactions of his or her domain with the enterprise domains.
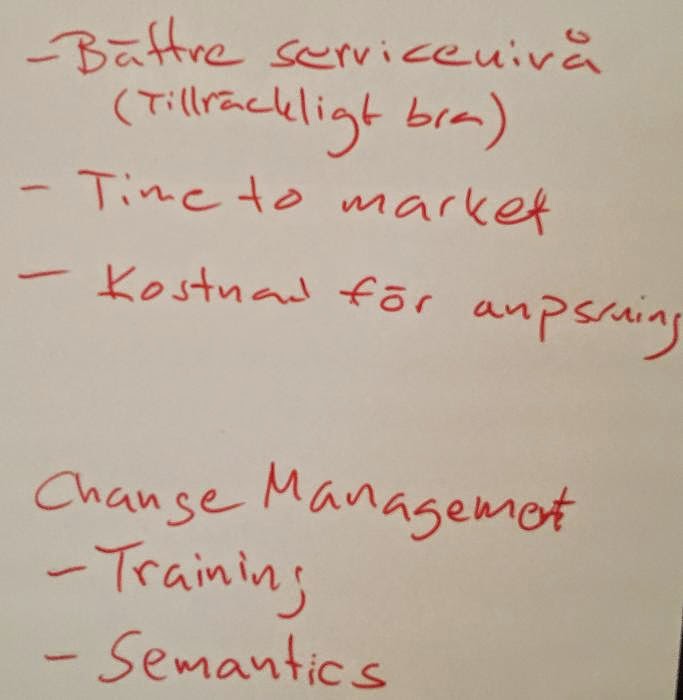
Shadow BI can improve efficiency in decision
making provided the data quality is fit for purpose.
This is
absolutely true: data quality in the sense of “fit for purpose” is a more agile
approach to data quality than the often used “within specs” approach in data
quality. Marketing will use a fuzzier definition of what a customer is but a
very strict definition of who he is and where he is. Logistics will not even
bother what a customer is as long as the package gets delivered on the right
spot and someone signs for the goods reception. This means that enterprise
master data strategies should manage the common denominator in data definitions
and data quality but leave enough room for specific use of subsets with
specific business and data quality rules.
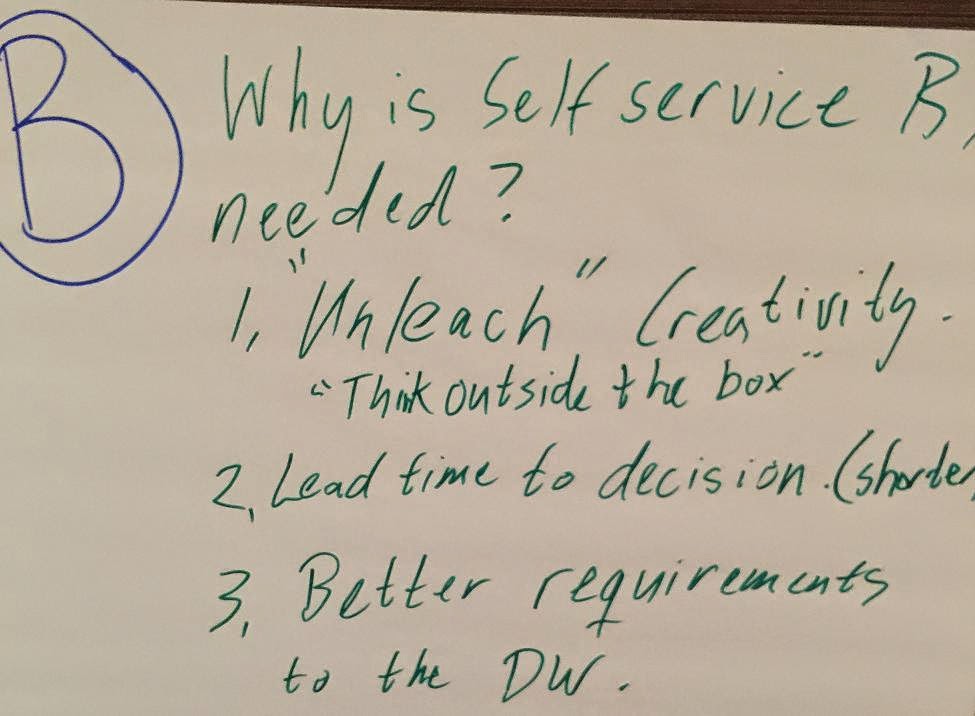
This under-the-radar form of BI can also foster
innovation as users are unrestrained in discovering new patterns, relationships
and generate challenging insights.
Just as in
any innovation process, not all shadow BI products may be valuable but the
opportunity cost of a rigid, centralized BI infrastructure and process may be
an order of magnitude greater than the cost of erroneous decision support
material. On one condition: if the innovation
process is supported by A/B testing or iterative roll out of the newly inspired
decision making support. I often use the metaphor of the boat and the rocket:
if the boat leaks, we can still patch it and use a pump to keep the boat afloat
but two rubber O-rings caused the death of the Challenger crew in 1986.
 |
| "Bet your company" decisions are better not based on shadow BI. |
The group came up with both technical and predominantly
organizational and HRM solutions.
This proves
for the nth time that Business Intelligence projects and processes are of a mixed
nature between technical and psychological factors. It is no coincidence that I
use concepts from Tversky and Kahneman and other psychologists who studied
decision making in the business analysis process.
In conclusion
Strategy
alignment and adopting operational systems and processes for analytical purpose
were also mentioned in the peer exchange.
Exactly these two are the root causes of poor decision making support if poorly managed.
In the next
post I will dig a bit deeper into these two major aspects. In the mean time, have a look at this sponsored message:
 |
| The full story on strategy alignment and tuning organisations for better analytics is within reach |